t-SNE
- Definition
- T-SNE is a technique for visualizing high-dimensional data by embedding it into 2 or 3 dimensions while preserving local similarities. Think of squashing high-dimensional structure into a scatterplot that keeps neighbors together. T-SNE differs from PCA by focusing on local structure for visualization (not global variance) and isn't suitable as a general-purpose dimensionality reduction for downstream modeling.
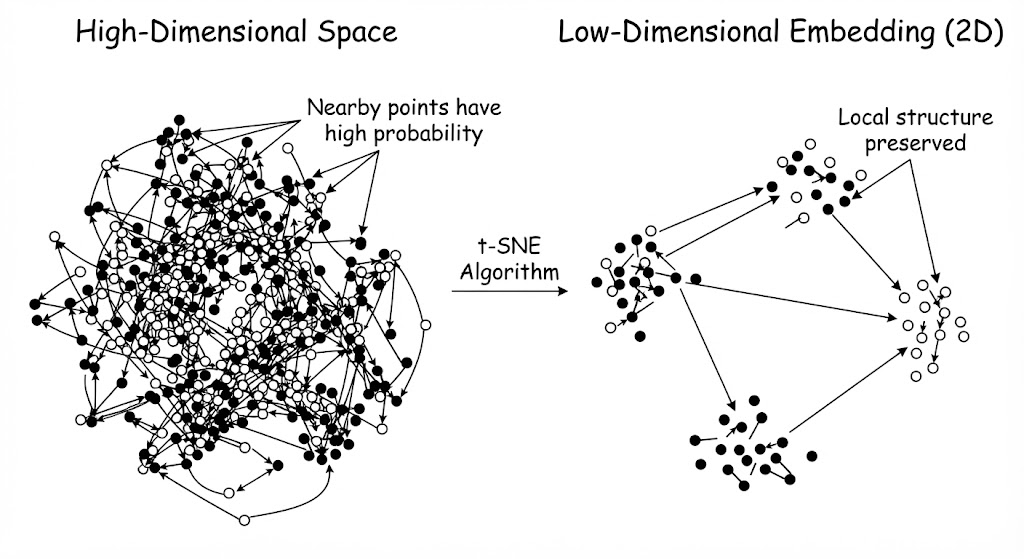
How does it work?
t-SNE models learn from labeled examples: prepare features, choose a model family, train on examples, and validate on held-out data. Pay attention to data preprocessing, class imbalance, and hyperparameter tuning.
Examples
- Visualising embeddings — Project high-dimensional model embeddings to 2D for cluster inspection in ML experiments.
- Single-cell RNA-seq analysis — Visualise cell populations and subtypes from expression profiles.
- Debugging representation quality — Use t-SNE plots to inspect if different classes separate in learned embeddings.
Problems
- Results are highly sensitive to the perplexity parameter
- Doesn't preserve global structure or distances reliably, only local
- Slow and memory-intensive on large datasets
- Non-deterministic — different runs can produce different layouts
- Cluster sizes/distances in the plot can be misleading